Housing Market Snapshot - Eastern City District
The Housing Story in Eastern City
The Eastern City District includes the Central Business District (CBD), Port Botany, Sydney International and Domestic Airport, specialist health facilities, extensive transport infrastructure and educational institutions, making it a highly desirable location to live; attracting both high and low income households.
There is significant competition within the District and pressure on the housing markets, particularly the large private rental market. Consequently it is also a high price location for rent and purchase. There is a diversity of housing demand, income levels, ages, household composition, housing supply, needs and trends. However, increasingly low income households are being priced out of the District, impacting on the diversity of the region and the economy – including key workers. Eastern City does not comprise a single housing market and will require a variety of housing responses to meet needs
Housing Demand
Between 2016 and 2021, the population in this District increased by 2.8%. However, this figure masks considerable variation in population change amongst the LGAs of the District. Changes in population between 2016 and 2021 ranged from a 13.1% increase in Strathfield to a -4.6% decline in Randwick. Woollahra (-1.4%) was the only other Eastern City LGA to lose population over this period.
This District has a slightly older age profile compared to Greater Sydney. The population is predominantly 20-54 year olds (i.e. working age adults). Lone person is the most common household type comprising 29.2% of all households in the District (compared to 22.2% in Greater Sydney), followed by couple only households at 26.1% (23.3% in Greater Sydney) and couple family with children 23.0%. (34.4% in Greater Sydney). Eastern City experienced larger increases in the proportion of lone person (3.6%) and couple family without children households (2.1%) between 2016 and 2021 than for Greater Sydney.
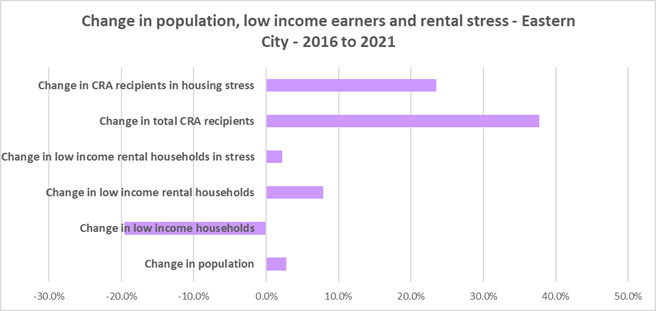
High income households are the most common income group in Eastern City at 62.6% (well up from 48.8% of all households in 2016) and compared with 49.7% high income households in Greater Sydney at 2021. Between 2016 and 2021 Eastern City experienced a decline in the number of both low and moderate income households and a strong increase in the number of high income households. Nevertheless, there was an increase in low income rental households over this period.
At the same time, the Eastern City District has significant numbers of homeless and marginally housed people.
What’s happening in the Market?
At the 2021 Census, the most common tenure type in the Eastern City District was rental (unlike other districts in the city, where purchasing is the largest tenure type, or regional NSW where outright ownership is the most common tenure) – comprising 49.8% of all households.
Rental prices are well above the Greater Sydney median. Between 2020 and 2022 when Covid restrictions were relaxed, there were strong increases in median rents across the District.
At April 2023 the vacancy rate in the inner ring of Sydney was 1.5% and for the middle ring was 1.2%, indicating a tight rental market across Sydney and most particularly in the middle ring. This district also reports high rates of rental stress. In 2021, 99.1% of very low income and 85.5% of low income households in Eastern District were in rental stress, which is an increase from 2016.
In 2023, according to Inside Airbnb, there are 22,659 listings in Sydney. Of these, 13,516 or 59.6% are in Eastern City, with 5,019 in City of Sydney, 2,898 in Waverley, 1,820 in Randwick, 1,413 in the Inner West and Woollahra 871. Airbnb represents a significant proportion of rental properties in most Eastern City LGAs, as shown in the Table in the section on key statistics below, and is potentially displacing long term tenants.
Purchase affordability is non-existent in every LGA in the District for very low and low income households. At 2021 in Greater Sydney, theoretically 18.1% of sales were affordable for purchase by moderate income households – in Eastern City this varied from 0% in Waverley and Woollahra to 43.6% in Strathfield, with Bayside the only other LGA with better purchase affordability than Greater Sydney with 21.9%.
It’s worth pointing out that housing costs have been rising much faster than wages in Australia. According to Core Logic “While wages increased 81.7% in the past 20 years, Australian home values have grown 193.1%”.
What’s happening with supply – and is it a good match?
Unlike Greater Sydney, in Eastern City District flats are the most common housing type overall, comprising 58.4% of homes, compared to 12.9% in Greater Sydney. At the 2021 Census, 11.7% of homes were unoccupied in Eastern City compared to 8.0% on average in Greater Sydney.
Eastern City also has a very different bedroom mix to the average for Greater Sydney and the Rest of NSW, where three and four bedroom homes comprise the overwhelming majority of homes. At the 2021 Census, Eastern City had 2.3% studio dwellings, 16.6% one bedroom homes, 40.1% two bedroom homes, 24.9% three bedroom homes and 14.9% four or more bedroom homes.
Despite the fact that between 2016 and 2021 Eastern City lost low income households, there was an increase in low income rental households and low income rental households in housing stress. There has also been a significant increase in rents, tightening of the rental market and decline in affordable private rental in Eastern City. There is a large and growing gap between the increasing number of low income earners in the private rental market and the declining number of private rental properties that are affordable for low income households. There is also no option for low income purchasers to buy a home in Eastern City. Affordable private rental housing, as measured by new rental bonds lodged that were affordable to low income households, declined by 16.2% in Eastern City just between 2021 and 2022.
Eastern City has a better mix of bedroom numbers with respect to household size than any other District in Greater Sydney or region of NSW. Nevertheless, with an aging population and significant affordability issues, it is important to ensure a range of housing and a good bedroom mix to meet current and future demand. The proportion of studio dwellings is still very small and only City of Sydney has a significant proportion of one bedroom homes. This means smaller households must share housing to make housing more affordable.
It also limits the opportunity for empty nesters or older single households to downsize to smaller more manageable homes within their communities. This can impact on the independence of older residents and their ability to age in place. This will become increasingly important as the population of Eastern City is forecast to have an increase in older age groups.
There is evidence that residents are choosing this location in spite of high housing costs relative to income and that there is movement out of the Eastern City District (and within the District from the highest priced to somewhat more affordable areas such as Inner West and Bayside) due to affordability issues.
There is a strong argument for affordable housing provision targeted to lower income households, including students and key workers.
Change 2016 to 2021
| Change in population | 2.8% |
|---|---|
| Change in low income households | -19.6% |
| Change in low income rental households | 7.9% |
| Change in low income rental households in stress | 2.2% |
| Change in total CRA recipients | 37.7% |
| Change in CRA recipients in housing stress | 23.5% |
Comparative Statistics Eastern District
- Population at 2021: 1,000,974
- Number of dwellings at 2021: 455,052
- Number of households at 2021: 422,795
- Number of very low and low income households at 2021: 94,210
- Number of rental households at 2021: 197,117
- Number of very low and low income rental households at 2021: 43,539
- Number of very low and low income renters in Housing Stress at 2021: 38,061
- Increase in low income renters 2016 to 2021: 3,201
- Decline in new bonds lodged affordable for low income households 2021-2022: -1,169
- Number of new bonds lodged affordable for low income households 2021: 6,037
- Number of Homeless at 2021: 9,585
- Number marginally housed at 2021: 4,582
Key District Statistics
- Number of lone person households: 123,577
- Number of couple only households: 110,245
- Number of studio dwellings: 9,145
- Number of one bedroom dwellings: 66,780
- Number of unoccupied dwellings: 53,191
| LGA | Airbnb | % Airbnb rented out as total home | Airbnb no. total home | Total rental | Airbnb total home as % of total rental |
|---|---|---|---|---|---|
| Bayside | 825 | 42.7 | 352 | 27582 | 1.3 |
| Burwood | 229 | 48.5 | 111 | 6728 | 1.7 |
| Canada Bay | 305 | 58.4 | 178 | 13171 | 1.4 |
| Inner West | 1413 | 68.2 | 963 | 32779 | 2.9 |
| Randwick | 1820 | 63.6 | 1158 | 24107 | 4.8 |
| Strathfield | 136 | 41.9 | 57 | 7331 | 0.8 |
| Sydney | 5019 | 69.6 | 3493 | 63620 | 5.5 |
| Waverley | 2898 | 73.6 | 2133 | 13597 | 15.7 |
| Woollahra | 871 | 74.9 | 652 | 8202 | 8.0 |
| Eastern City | 13516 | 67.3 | 9097 | 197117 | 4.6 |
Additional information
Additional information on: