Housing Market Snapshot - Hunter Sub Region
The Housing story in the Hunter
The Hunter region comprises the regional city of Newcastle, plus the local government areas of Cessnock, Dungog, Lake Macquarie, Maitland, Mid Coast, Muswellbrook, Port Stephens, Singleton and Upper Hunter.
Infrastructure Australia’s report “2022 Regional Strengths and Infrastructure Gaps” notes that the Hunter has a wealth of productive agricultural and viticultural lands, natural resources and coastal assets, has seen urban renewal in Newcastle, significant industry diversification including into renewables and technology, as well as innovation in agriculture and mining. There is a designated Renewable Energy Zone and the region is emerging as an innovation hub.
As a consequence, along with the fact that it is more affordable than Sydney, it is an increasingly desirable location to live and work. Infrastructure Australia’s report also cites housing – the availability, affordability and diversity of housing – as a key infrastructure gap in the Hunter.
What’s the housing demand?
The population is growing, older age groups and smaller households are increasing as is likely housing demand for studio, one and two bedroom homes. There has been a strong increase in low income households suggesting strong demand for affordable rental and purchase.
Between 2016 and 2021, the population in the Hunter increased by 9.25%.
The median age of the population of the Hunter LGAs at the 2021 Census ranges between 36 years (Maitland) and 54 (Mid Coast). Most of the Hunter LGAs have a much younger median age than Mid Coast, however there is variation in the age profiles of the Hunter LGAs. Generally Maitland, Cessnock, Muswellbrook and Singleton have younger age profiles, while Mid Coast, Port Stephens and Dungog tend to have older age profiles. This implies the need for a diverse range of housing to appropriately accommodate residents throughout the housing life cycle, particularly given the forecast increase in older age groups.
At the 2021 Census in the Rest of NSW, couple only and lone person households are the largest two household types – this is also true for Mid Coast and Upper Hunter. Most of the other Hunter LGAs have couple families with children and couple only households as the largest two household types – the exceptions being Muswellbrook and Newcastle where couple family with children and lone person households are the largest two household types. Again a diverse range of housing, including for smaller households, is required to meet local need, particularly as there has been an increase in couple only and lone person households and decline in couple family with children households between 2016 and 2021.
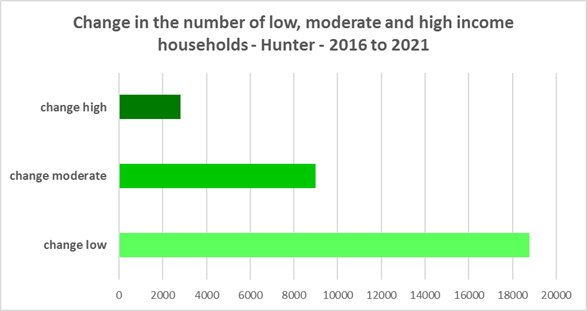
At the 2021 Census, low income households comprise the largest proportion of all households in the Hunter region as a whole and each Hunter LGA, with the exception of Cessnock (where high income households are the largest group). Between 2016 and 2021 the number of low income households increased in every Hunter LGA except for Cessnock and Mid Coast, which both experienced a decline in the number of low income households. Over the same period, the number of moderate income households increased in every Hunter LGA and the number of high income households declined in every Hunter LGA except for Cessnock and Mid Coast, which both experienced an increase in high income households. Households are attracted to the Hunter (particularly the lower Hunter) from Sydney at least in part because of the relative housing affordability of the Hunter for lower income earners. This may explain some of the shifts in income between 2016 and 2021 and suggests demand for affordable rental and purchase by low and moderate income households is strong.
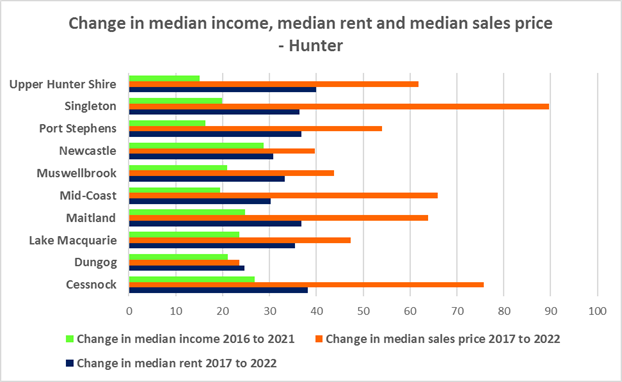
What’s happening in the market?
The Hunter has experienced strong price growth in both rents and sales, prolonged tight vacancy rates indicating an undersupply of private rental, a significant loss of affordable rental housing supply yet strong demand from the significant number of low income residents, with many residents in housing stress. Generally housing costs are rising much faster than incomes. There is evidence that short term holiday rentals such as Airbnb are impacting the supply of housing, including long term rental and affordable housing in cities and coastal communities, including those within a three hour radius of capital cities.
There has been strong growth in median rents for all dwellings (including all housing types and all bedroom categories) in the Hunter region for some time and particularly since Covid restrictions were relaxed. At April 2023 the vacancy rate in Newcastle was 1.8%, in the rest of the Hunter the vacancy rate was 2.0% and on the Mid North Coast was 1.4%, indicating a tight rental market.
The region experienced a significant decline in affordable rental bonds lodged, and consequently loss of affordable housing between 2017 and 2022 – with a -25.0% drop. At the same time there has been an increase in the proportion of lower income households in rental stress. At 2021 in the Hunter, 94.9% of very low income and 73.6% of low income households were in rental stress, up 2.1% and 10% respectively from 2016.
The last decade has seen strong increases in median sales prices in the Hunter as well. At 2021 there were no sales affordable for very low income households in the majority of Hunter LGAs although for low income households there was limited opportunity outside of Lake Macquarie, Maitland, Newcastle and Port Stephens. 47.2% of very low and low income purchasers in the region were in housing stress, however there are considerably more very low and low income renters in housing stress than purchasers.
What’s happening with supply – and is it a good match?
Across much of NSW housing supply has not kept pace with demand, with significant outmigration from cities to regional areas, particularly during Covid, tight rental vacancy rates, housing costs have increased faster than income and there is insufficient affordable housing and a lack of housing diversity to meet local need. There has also been the impact of floods in parts of this region, having adverse impacts on the housing market and communities more broadly. There is clear demand for affordable rental housing and declining supply of affordable housing available in the private rental market.
The majority of households in the Hunter are couple or single person households, yet the housing stock is primarily comprised of three or four bedroom detached homes. The housing stock needs to adapt to better match households requirements. Proactive measures are necessary to diversify bedroom mix and increase the supply of studio and one bedroom dwellings in particular to provide housing choice to smaller households.
At the 2021 Census, the clear majority of occupied dwellings in the Hunter were separate houses, comprising 81.8% of all occupied dwellings. More to the point, across the Hunter 41.2% of dwellings have three bedrooms and a further 35.3% have four or more bedrooms. Only 0.4% of homes are studios, 4.1% have one bedroom and 17.7% have two bedrooms. Given that lone person and couple only households comprise 51.8% of all households in the Hunter, the fact that studio and one bedroom homes combined make up just 4.5% of the housing stock shows a mismatch between household type and dwelling size and a significant lack of housing choice for smaller households.
While it is encouraging that there have been increases in the proportion of studio, one and two bedroom homes between the 2016 and 2021 Census, ideally there should be a closer match between household size and bedroom number to offer some housing choice for residents. Two bedroom dwellings in particular offer the most flexibility, given they are also suitable for small families and share households and allow older residents to have family members or carers to stay while giving them a more manageable size home to maintain. This is important given the projected increase in older households in the region.
Change 2016 to 2021
Comparative statistics
- Number of dwellings at 2021: 324,654
- Population at 2021: 773,135
- Number of households at 2021: 307,806
- Number of rental households at 2021: 82,121
- The number of Very Low and Low income households at 2021: 138,928
- Number of Very Low and Low income rental households at 2016: 23,964
- Number of Very Low and Low Income Renters in Housing Stress at 2021: 19,713
- Reduction in number of new bonds lodged affordable to low income households (2017-2022): 699
- Number of new bonds lodged affordable to low income households 2022: 2,095
- Number of Homeless at 2021: 2,464
- Number of Marginally Housed at 2021: 1,752
Key regional statistics
- Number of lone person households: 78,030
- Number of couple only households: 85,322
- Number of studio dwellings: 1,109
- Number of one bedroom dwellings: 11,938
- Number of caravan, cabin, houseboat and improvised dwellings: 1,744
- Number of unoccupied dwellings: 30,597
Additional information
Additional information on: