Housing Market Snapshot - South and East Tablelands
The Housing story in the South and East Tablelands
The South and East Tablelands Region is comprised of the nine local government areas of Bega Valley, Eurobodalla, Goulburn Mulwaree, Hilltops, Queanbeyan-Palerang, Snowy Monaro Regional, Upper Lachlan, Wingecarribee and Yass Valley. This region includes the southern highlands and tablelands just south of Sydney through to Queanbeyan adjoining Canberra, the south coast and the alpine region through to the orchard and winegrowing areas of Young. It includes coastal and marine environments, national parks, rainforests, mountains, lakes, vineyards, woodlands and farmland. The south coast is a popular tourist and sea change destination with a significant retiree population. The southern inland has been affected by demand for affordable housing from neighbouring Canberra and Sydney. The region was significantly impacted by bushfires and there has been noteworthy outmigration from the cities to the South and East Tablelands during the pandemic, with the increased capacity to work remotely, which has increased the demand for housing and influenced the housing market.
Infrastructure Australia’s report “2022 Regional Strengths and Infrastructure Gaps”, splits the South and East Tablelands into the Far South Coast and the Southern Inland regions. The report nominates Healthcare and social assistance, Manufacturing and Tourism as the key regional growth industries for the Far South Coast, and for the Southern Inland it nominates Healthcare and social assistance, Energy and Tourism. For both parts of the region the report notes that housing – availability, affordability and diversity – is a key infrastructure gap.
What’s the housing demand?
Between 2016 and 2021, the population of the South and East Tablelands grew by 9.3%. On an individual LGA basis, population growth ranged from 13.0% in Queanbeyan-Palerang Regional to 4.1% in Hilltops. Queanbeyan-Palerang Regional had the largest increase in numeric terms with an additional 7,277 residents, followed by Wingecarribee with 4,831 and Eurobodalla with 3,364.
The median age of the population of the South and East Tablelands LGAs at the 2021 Census ranges between 38 years (Queanbeyan-Palerang) and 54 (Eurobodalla). This compares to the median age for the Rest of NSW (excluding Sydney) of 43 years. The big range in median age indicates that there are very different age profiles within the region. The diversity of age groups requires a range of different housing to meet the needs of the community throughout the housing life cycle. However the higher median age and higher proportions of older age cohorts indicates that there is a need for housing to suit older residents most particularly in Bega Valley, Eurobodalla and Wingecarribee. Although increasingly this will be an issue for all the South and Eastern Tablelands LGAs as the population aged over 65 is forecast to increase.
At the 2021 Census in the South and East Tablelands, couple families without children (29.7%) and lone person households (26.0%) are the largest two household types, but individual LGAs vary. Overall in the region there has been a shift since the 2016 Census, with an increase in the proportion of couple families without children and lone person households and declines in the proportion of “other” households (which includes multi-family households) and couple family with children households in the region. Given the number of lone person and couple only households, it is important to ensure that housing choice in the community reflects this through availability of studio, one and two bedroom homes.
At the 2021 Census, low income households comprise the largest proportion of all households in every South and East Tablelands region LGA, with the exception of Queanbeyan-Palerang. Between 2016 and 2021 while the number of low income households increased in the South and East Tablelands as a whole, the number of low income households declined in Eurobodalla, Queanbeyan-Palerang, Snowy Monaro Regional and Wingecarribee. While low income households increased in the region by 2.6%, moderate income households increased by 3.6% and high income households by 26.0% over this time frame. There is evidence that tree and sea changers, with the increased capacity to work remotely, as well as retirees, are moving out of cities and into this region, displacing lower income households. This indicates the need for affordable housing provision.
What’s happening in the market?
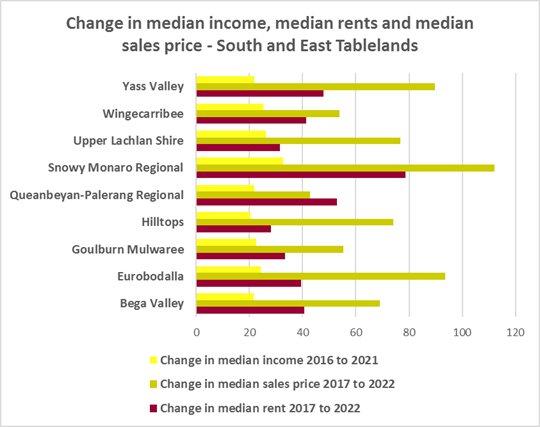
There have been strong increases in median rents in the South East and Tablelands region, particularly since the mid 2000’s. However, the median rents for Snowy Monaro Regional fluctuate more than other LGAs in the region due to strong impact from tourism. Nevertheless, between 2017 and 2022, median rents increased by between 28.0% in Hilltops and 78.6% in Snowy Monaro Regional.
Vacancy rates in this region have shown periods of both over and undersupply, but since April 2020 have been mostly below 3% in both the South Coast and South Eastern regions of NSW. This indicates a tight rental market in both areas. However, generally there is strong seasonal variation in vacancy rates in both regions.
The general trend across the region has been for a decline in the proportion of private rental stock which is affordable for very low and low income households. At June 2022, every South and East Tablelands LGA (excepting Hilltops), had a lower proportion of affordable rental for very low income households than the Rest of NSW average of 17.0%. At June 2022, Wingecarribee (14.9%), Yass Valley (26.9%), Snowy Monaro Regional (31.7%), Eurobodalla (38.3%) and Queanbeyan Palerang (38.4%) had a lower proportion of affordable rental for low income households than the Rest of NSW average of 45.4%
At June 2021 the proportion of very low income households in rental stress in the South and East Tablelands was 92.2%, above the Rest of NSW average of 91.7%. The proportion of low income households in rental stress in the region was 68.7%, just above the Rest of NSW average of 68.3%. This demonstrates that significant proportions of lower income rental households are paying too much of their income in rent, with consequent affordability problems.
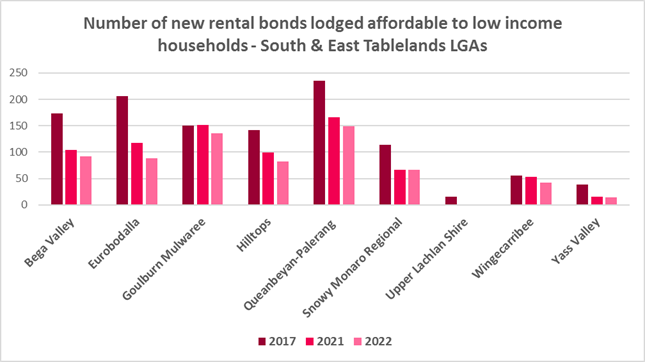
The region had a decline of 40.9% in the number of new rental bonds lodged that were affordable to low income households between 2017 and 2021. Nationally there are increasing numbers of households relying on the private rental market as a long term tenure as housing costs have increased much faster than wages. It is therefore important to encourage tenure diversity and a range of price points to meet local needs.
What’s happening with supply – and is it a good match?
At the 2021 Census there were 131,813 dwellings in the South and East Tablelands region. The overwhelming majority of housing in the region would have been built at a time when couple families with children were the dominant household type. Now smaller households (couples and single person households) predominate and are likely to increase across the region, particularly as the population ages.
The South and East Tablelands has little variation in the number of bedrooms per dwelling. Across the region 38.4% of dwellings have three bedrooms and a further 39.1% have four or more bedrooms, totalling 77.5% with three or more bedrooms. Only 0.5% of homes are studios, 4.2% have one bedroom and 16.2% have two bedrooms. Given that lone person and couple only households comprised 50.9% of all households in the South and East Tablelands, the fact that studio and one bedroom homes combined comprise just 4.7% of the housing stock shows a mismatch between household type and dwelling size and a significant lack of housing choice for smaller households.
While there has been a small increase in studio and one bedroom homes since the 2016 Census, the number is significantly outweighed by the enormous increase in the number of three and four plus bedroom homes. The forecast increase in older age groups in the region is likely to increase the demand for smaller, more manageable and affordable homes. The housing stock needs to adapt to better match households requirements. Two bedroom dwellings in particular offer the most flexibility, given they are also suitable for small families and allow older residents to have family members or carers to stay while giving them a more manageable size home to maintain.
In addition there is a clear need to increase the supply of affordable rental housing. Given the ageing population and the displacement of low income households in parts of the region, there is a need to provide more housing that is adaptable, accessible, well located, secure, low maintenance and affordable. Those most in need are households in the private rental market, who struggle to afford housing on an Aged Pension or inadequate superannuation.
Change 2016 to 2021
Comparative statistics
- Population at 2021: 291,316
- Number of dwellings at 2021: 131,813
- Number of households at 2021: 119,941
- Number of Very Low and Low income households at 2021: 44,853
- Number of rental households at 2021: 26,300
- Number of Very Low and Low income rental households at 2021: 7,230
- Number of Very Low and Low Income Renters in Housing Stress at 2021: 5,627
- Reduction in number of Affordable Rental Bonds Lodged (2017-2022): -463
- Number of New Bonds Lodged Affordable for low income households 2022: 669
- Number of Homeless at 2022: 834
- Number of Marginally Housed 2022: 661
Key regional statistics
- Number of lone person households: 31,166
- Number of couple only households: 35,632
- Number of studio dwellings: 584
- Number of one bedroom dwellings: 4,638
- Number of caravan, cabin, houseboat and improvised dwellings: 790
- Number of unoccupied dwellings: 20,629
Additional information
Additional information on:
What’s happening with demand is at