Housing Market Snapshot - Central City District
The Housing story in Central City
Central City includes the LGAs of Blacktown, Cumberland, Parramatta and The Hills Shire. This area has undergone significant change over the past decade and significant investment confirmed in infrastructure, intensification of retail, commercial and residential development in and around the Parramatta CBD and the North West Growth Centre and it is home to extensive heath, educational, recreational and other amenities.
This district is set for further significant population, dwelling and employment growth and the provision of affordable and appropriate housing will be integral to this growth.
What’s the housing demand?
Between 2016 and 2021, the population in this District increased by 15.4%. The Hills and Blacktown LGAs had the second and third largest percentage increase in population in the state in that five year period.
Central City has a younger age profile than the Greater Sydney average. However, there will be an increasing need for housing to suit seniors and frail aged residents as the number of residents in these age groups is forecast to increase.
With an increase in lone person and couple only households since the 2016 Census, the diversity of age groups and household types requires a range of different housing to meet the needs of the community throughout the housing life cycle.
Unlike the average for Greater Sydney, Central City has a much higher proportion of low income households (37.9% compared to 32.1%), higher proportions of moderate income households (22.7% compared with 18.2%) and lower proportions of high income households (39.6% compared to 49.7%). The numbers of very low and low income renters in Central City are increasing at a much faster rate than low income households generally in this District – indicating increasing demand for affordable rental housing.
What’s happening in the market?
There has been strong growth in median rents, especially since 2020, when Covid restrictions were relaxed. At April 2023 the vacancy rate in the middle ring of Sydney was 1.2% and for the outer ring was 1.3%, indicating a very tight rental market – and chronically so as it has been under 2% since July 2021 in the outer ring and April 2022 for the middle ring.
There has been a decline in the number and proportion of new bonds lodged affordable to very low and low income households in Central City since 2020 and the number of very low and low income renters in stress is increasing. The loss of affordable housing is having an impact on key workers.
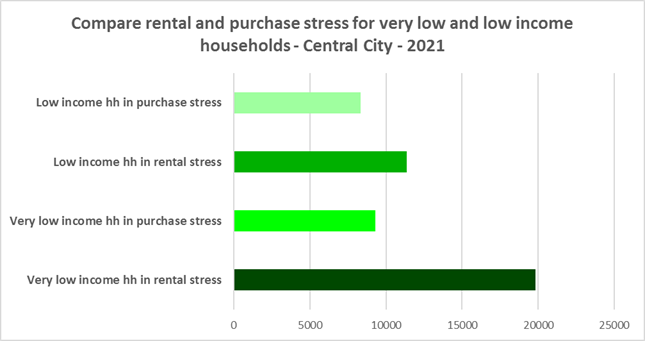
There has also been strong growth in median sales price and while purchase affordability for low and moderate income households in Central City is low, it is generally better than the average for Greater Sydney. There are high proportions of lower income households in purchase stress, but much higher numbers of lower income households in rental stress.
What’s happening with supply – and is it a good match?
At the 2021 Census, the majority of occupied dwellings in Central City were separate houses, comprising 63.8% of all occupied dwellings, well above the average of 55.4% for Greater Sydney. However this is more diverse than in 2016 when 65.3% of homes in Central City were separate houses.
Central City also has insufficient variation in the number of bedrooms per dwelling, with 31.7% of dwellings having three bedrooms and a further 39.5% having four or more bedrooms, totalling 71.3% with three or more bedrooms. Only 0.4% of homes are studios, 4.9% have one bedroom and 22.0% have two bedrooms in Central City. This is an improvement from 2016, when one bedroom homes comprised 3.6% and two bedrooms 19.7% of residential stock on average across the region. There has been no increase in the proportion of studio dwellings since 2016 however.
Given that lone person and couple only households comprised 37.5% of all households in Central City (up from 35.7% in 2016), the fact that studio and one bedroom homes combined comprise just 5.3% of the housing stock means there is a mismatch between household type and bedroom number. There are insufficient housing options for smaller households.
This mismatch can impact on affordability, with smaller households required to consume more housing than they need or to share because of lack of choice. It also limits the opportunity for empty nesters or older single households to downsize to smaller more manageable homes within their communities. This can impact on the independence of older residents and their ability to age in place.
There is a large and growing gap between the increasing number of low income earners in the private rental market and the declining number of private rental properties that are affordable for low income households in Central City.
Low income (including very low income) households have increased by 7.0% between 2016 and 2021 (from 122,001 to 130,524). Over the same time period, low income rental households have increased by 29.7% in Central City. Clearly low income rental households are increasing at a faster rate than low income households generally in this District.
Yet affordable private rental housing, as measured by new rental bonds lodged that were affordable to low income households, declined by 7.7% in Central City just between 2021 and 2022. There is a clear need for more affordable rental accommodation to begin to address the significant demand supply imbalance
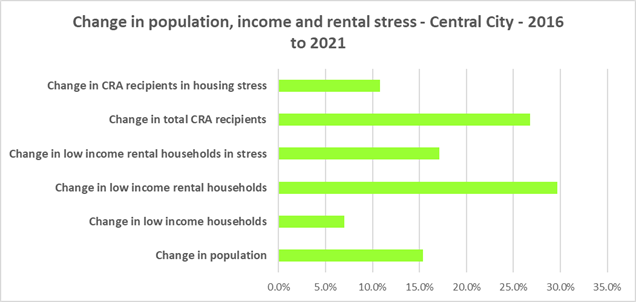
Change 2016 to 2021
| Change in population | 15.4% |
|---|---|
| Change in low income households | 7.0% |
| Change in low income rental households | 29.7% |
| Change in low income rental households in stress | 17.1% |
| Change in total CRA recipients | 26.8% |
| Change in CRA recipients on housing stress | 10.8% |
Comparative Statistics
- Population at 2021: 1,080,820
- Number of dwellings at 2021: 371,098
- Number of households at 2021: 361,418
- Number of very low and low income households at 2021: 130,524
- Number of rental households at 2021: 127,964
- Number of very low and low income rental households at 2021: 43,478
- Number of very low and low Income Renters in Housing Stress at 2021: 31,155
- Reduction in number of new rental bonds lodged affordable to low income households 2021 to 2022: -486
- Number of new rental bonds lodged affordable to low income households 2022: 5,842
- Number of Homeless 2021: 4,843
- Number of Marginally Housed 2021: 6,559
Key regional statistics
- Number of lone person households: 61,273
- Number of couple only households: 74,381
- Number of studio dwellings: 1,416
- Number of one bedroom dwellings: 16,762
- Number of unoccupied dwellings: 26,166
The graph below compares the number of very low and low income renters in stress with the number of very low and low income purchasers in stress in Central City.
Additional information
Additional information on: