Housing Market Snapshot - Western City District
Western City is the largest district in Greater Sydney and includes Hawkesbury, Blue Mountains, Wollondilly, Penrith, Fairfield, Liverpool, Camden and Campbelltown. Although historically its employment opportunities and transport links were relatively limited, this area is expected to continue to undergo significant growth and development with the construction of the Badgerys’s Creek Aerotropolis, improved rail and transport options and other amenities.
This is a very multicultural and diverse area, and captures extensive bushland reserves, rivers, valuable rural industries and the Blue Mountains World Heritage area.
What’s the housing demand
Between 2016 and 2021, the population in this District increased by 12.7%. Camden LGA had the largest percentage increase in population in the state in that five year period. In terms of total numbers of population increase, Camden was second in the state after Blacktown and Liverpool was fifth (after The Hills and Parramatta), Penrith 6th (after Canterbury-Bankstown) and Campbelltown 7th – indicating that Western City has experienced significant population growth in that time frame.
Overall, Western City has a younger age profile than the average for Greater Sydney – but this is not uniformly the case across the District, with Blue Mountains, for example, having an older age profile. The diversity of age groups requires a range of different housing to meet the needs of the community throughout the housing life cycle, particularly with the forecast increase in older age groups.
Household types in the Western City District conform to the pattern of the average for Greater Sydney, with couple families with children being the largest household type, followed by couple families without children and lone person households. Between 2016 and 2021 in Western City District there was a decline in the proportion of couple family with children households, increases in the proportion of couple family without children and lone person households and a decline in the proportion of one parent families and other households. This indicates increasingly there is a need for the local housing stock to cater for smaller household types.
Western City has a much higher proportion of low income households than Greater Sydney (39.3% compared to 32.1%), as well as higher proportions of moderate income households (21.5% compared with 18.2%) and much lower proportions of high income households (39.2% compared to 49.7%). Between 2016 and 2021 the number of low income households declined in Western City District as a whole (by -3.7%) but not in every LGA. Over the same period, the number of moderate income households increased in the District (19.5%) but again not in every LGA. High income households (33.8%) increased in Western City as a whole and in every LGA in the District over that five year period.
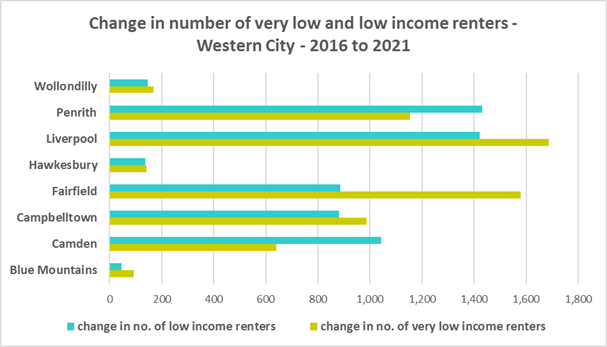
Over the same period, despite the decline in low income households generally, the number of very low income renters and low income renters increased in Western City as a whole by 32.4% and 35.3% respectively, as well as increasing in every LGA in the District.
What’s happening in the market?
Western City has historically provided more affordable accommodation than other parts of Sydney. However the District has a low proportion of private rental accommodation – well below the Sydney average. Increasingly the private rental market has become a long term tenure for many, rather than an interim tenure between leaving home and purchasing a home. It is also increasingly unaffordable, with a very tight rental market and extremely limited options for purchase for lower income households.
There has been strong growth in median rents, especially since 2020, when Covid restrictions were relaxed. A vacancy rate of 3% is regarded as representing a balance between supply and demand. At April 2023 the vacancy rate in the middle ring of Sydney was 1.2% and for the outer ring was 1.3%, indicating a very tight rental market – and chronically so as it has been under 2% since July 2021 in the outer ring and April 2022 for the middle ring.
At 2021, 91.5% of very low income households and 48.8% of low income households in Western City were in rental stress and the number of very low income renters in stress increased across the District between 2016 and 2021. At the same time, the number of new rental bonds lodged affordable to low income households (and therefore affordable private rental housing) declined by -5.8% just in the twelve month period from 2021 to 2022.
Changes in the median sales price of both houses and flats in Western City over the ten years to March 2022 have generally been upward. Although a number of LGAs experienced a drop in the median sales price of houses and strata properties between 2018 and 2019/2020, they have all subsequently recovered and increased.
At June 2021, all the Western City LGAs, along with Greater Sydney, had 0.0% of sales affordable for purchase by very low income households. The proportion of housing affordable for purchase by low income households in 2021 in Western City ranged between 0.8% in Camden and 12.0% in Fairfield. Camden, Blue Mountains (1.4%), Wollondilly (1.5%) and Hawkesbury (1.6%) all had a lower proportion affordable for purchase than the average of just 2.3% in Greater Sydney.
At 2021 67.2% of very low income purchasers and 38.4% of low income purchasers in the District were in purchase stress – lower proportions than the average for Greater Sydney at 69.3% and 43.8% respectively.
What’s happening with supply – and is it a good match?
At the 2021 Census, the majority of occupied dwellings in Western City were separate houses, comprising 80.2% of all occupied dwellings, well above the average of 55.4% for Greater Sydney. While there has been an increase in the proportion of flats in the region between 2016 and 2021, the proportion of semi-detached, terrace and townhouses has declined and a greater diversity of housing is needed to suit different household types and age cohorts.
Western City also has insufficient variation in the number of bedrooms per dwelling, with 36.7% of dwellings having three bedrooms and a further 45.5% having four or more bedrooms, totalling 82.2% with three or more bedrooms. Only 0.3% of homes are studios, 2.9% have one bedroom and 13.2% have two bedrooms in Western City.
Given that lone person and couple only households comprised 39.2% of all households in Western City (up from 37.4% in 2016), the fact that studio and one bedroom homes combined comprise just 3.2% of the housing stock means there is a mismatch between household type and bedroom number. There are insufficient housing options for smaller households. The forecast increase in older age groups in Western City is likely to increase the demand for smaller, more manageable and affordable homes.
Ideally there should be an increase in the number of studio, one and two bedroom dwellings to suit these household types and to offer some housing choice. Two bedroom dwellings in particular offer the most flexibility, given they are also suitable for small families and allow older residents to have family members or carers to stay while giving them a more manageable size home to maintain. Providing choice in the number of bedrooms enables them to downsize and stay in their community and more broadly may help with affordability.
The evidence suggests that Western City is no longer particularly affordable for rent or purchase. Households move to this area in search of more affordable housing, yet there is less and less affordable housing available and there is insufficient diversity in the housing stock to meet local needs now and into the future. There is high demand for and evident need to increase the supply of private rental and provision of targeted affordable rental housing.
Change 2016 to 2021
| Change in population | 11.5% |
|---|---|
| Change in low income households | -3.7% |
| Change in low income rental households | 42.9% |
| Change in low income rental households in stress | -4.2% |
| Change in total CRA recipients | 20.1% |
| Change in CRA recipients on housing stress | 38.1% |
Comparative Statistics Western City District
- Population at 2021: 1,154,718
- Number of dwellings at 2021: 391,251
- Number of households at 2021: 386,575
- Number of very low and low income households at 2021: 145,073
- Number of rental households at 2021: 137,721
- Number of very low and low income rental households at 2021: 49,328
- Number of very low and low income renters in Housing Stress at 2021: 35,325
- Proportion of Affordable Private Rental Properties Lost (2021 – 2022): -5.8%
- Number of Homeless at 2021: 4,804
- Number of Marginally Housed at 2021: 6,925
Key District Statistics
- Number of lone person households: 71,169
- Number of couple only households: 80,367
- Number of studio dwellings: 1,169
- Number of one bedroom dwellings: 10,760
Additional information
Additional information on: