Housing Market Snapshot - Central Coast Region
The Housing story in the Central Coast
Located between Sydney and Newcastle, with significant areas of national park, forest, conservation areas, beaches and waterways, this region has historically been regarded as more affordable for rental and purchase than neighbouring Sydney and is forecast to experience population, household and dwelling growth to 2041.
There have been significant challenges to this region since the 2016 Census, including the desirability of coastal and other non-metropolitan regions for sea and tree changers becoming more pronounced due to the increased ability to work remotely during Covid - which have impacted the community and the demand for housing.
What’s the housing demand?
The population is growing, older age groups and smaller households are increasing as is likely housing demand for studio, one and two bedroom homes. There has been a strong increase in low income renters competing for a dwindling supply of affordable rental.
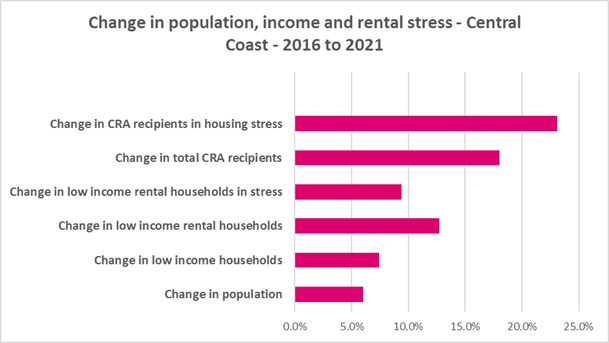
Between 2016 and 2021, the population in the Central Coast increased by 5.8%.
The age profile of the Central Coast is similar to that for the Rest of NSW, but with a slightly higher proportion of residents aged under 25, aged between 35 and 54, and aged over 75. This implies the need for a diverse range of housing to appropriately accommodate residents throughout the housing life cycle, particularly given the forecast increase in older age groups.
In the Central Coast at the 2021 Census, the two largest household types are couple families with children (27.1%) and lone person households (26.0%). However, couple families without children comprise 25.8% of all households in the Central Coast – a significant proportion. Between 2016 and 2021 the proportion of lone person and couple only households increased while the proportion of couple family with children households declined. This points to an increasing need for housing to suit smaller household types.
Unlike Sydney, but in line with the Rest of NSW, low income households comprise the largest proportion of all households in the Central Coast (51.3%), with moderate income households making up 22.1% of households and high income households 26.5%. Notably, while there was an increase in the number in all income groups in the Central Coast between 2016 and 2021, low income households increased the most. This pattern is not replicated in the neighbouring North District or most other Districts of Sydney.
Low income (including very low income) households increased by 7.4% between 2016 and 2021. Over the same time period, low income rental households have increased by 12.7% in the Central Coast. Clearly low income rental households are increasing at a faster rate than low income households generally on the Central Coast.
What’s happening in the market?
The Central Coast housing market is impacted by neighbouring Newcastle to the north and Sydney to the south and at the same time has much in common with regional NSW. While historically this region has been more affordable for both rental and purchase than Sydney, there has been strong price growth, tight vacancy rates, a loss of affordable private rental housing and high and growing demand from the significant number of low income households resident here. Across Australia wage growth has been severely outpaced by increases in house prices.
There have been strong increases in median rents for all dwelling types, in all bedroom categories in the Central Coast region for well over a decade and especially since 2020, when Covid restrictions were relaxed. At April 2023, the vacancy rate in the Central Coast was 1.7%, in Sydney it was 1.3% and in the Hunter, it was 1.8%, indicating a tight rental market. The vacancy rate in the Central Coast has been below 3% for three years.
There has been a 28.5% decline in the number of new rental bonds lodged which are affordable to low income households between 2017 and 2022 on the Central Coast, which speaks to the loss of affordable private rental housing - at the same time that low income rental households have increased significantly.
There are high levels of rental stress amongst lower income households. At 2021, 93.7% of very low and 57.5% of low income households were in rental stress – with the number of both very low and low income rental households in stress up by 9.4% since 2016.
Median sales prices have also risen strongly on the Central Coast and purchase affordability for lower income households has declined. Nevertheless, the number and proportion of very low and low income purchasers in stress is significantly lower than the number and proportion of very low and low income renters in stress.
What’s happening with supply – and is it a good match?
Infrastructure Australia delivered a report “2022 Regional Strengths and Infrastructure Gaps” which cites housing – the availability, affordability and diversity of housing – as a key infrastructure gap in the Central Coast.
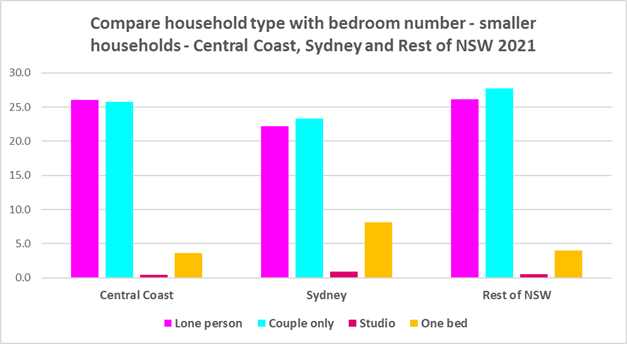
At the 2021 Census, the clear majority of occupied dwellings in the Central Coast were separate houses, comprising 78.4% of all occupied dwellings. The Central Coast (like the Rest of NSW generally) also has insufficient variation in the number of bedrooms per dwelling, with 38.7% of dwellings having three bedrooms and a further 36.7% having four or more bedrooms. Only 0.4% of homes are studios, 3.6% have one bedroom and 19.1% have two bedrooms in the Central Coast.
While 51.8% of households in the Central Coast are lone person or couple only, just 4.0% of dwelling stock is studio or one bedroom. This mismatch can impact on affordability, with smaller households required to consume more housing than they need or to share housing because of lack of choice.
It also limits the opportunity for empty nesters or older single households to downsize to smaller more manageable homes within their communities. This can impact on the independence of older residents and their ability to age in place. This will become increasingly important as the population of the Central Coast is forecast to have an increase in older age groups.
Households are attracted to the Central Coast from Sydney because of its’ relative affordability for lower income earners – suggesting demand for affordable rental and purchase by low and moderate income households is strong. Yet there is a large and growing gap between the increasing number of low income earners in the private rental market and the declining number of private rental properties that are affordable for low income households. There is also extremely limited opportunity for low income households to affordably purchase in the Central Coast.
There is a clear need for more affordable rental accommodation to begin to address the significant demand supply imbalance, particularly for lower income households and the increasing number of seniors and frail aged.
Change 2016 to 2021
| Change in population | 6.0% |
|---|---|
| Change in low income households | 7.4% |
| Change in low income rental households | 12.7% |
| Change in low income rental households in stress | 9.4% |
| Change in total CRA recipients | 18.0% |
| Change in CRA recipients on housing stress | 23.1% |
Comparative statistics
- Number of dwellings at 2021: 146,248
- Population at 2021: 346,596
- Number of rental households at 2021: 36,531
- The number of Very Low and Low income households at 2021: 67,602
- Number of Very Low and Low income rental households at 2021: 16,416
- Number of Very Low and Low Income Renters in Housing Stress at 2021: 12,445
- Decline in number of new rental bonds affordable to low income households (2017-2022): -28.5%
- Number of new rental bonds lodged affordable for low income households 2022: 1,225
- Number of Homeless at 2021: 802
- Number of Marginally Housed 2021: 571
Key regional statistics
- Number of lone person households: 35,866
- Number of couple only households: 35,678
- Number of studio dwellings: 558
- Number of one bedroom dwellings: 4,711
- Number of caravan, cabin, houseboat and improvised dwellings: 840
- Number of unoccupied dwellings: 14,532
Additional information
Additional information on:
What’s happening with demand is at