Housing Market Snapshot - South District
The Housing Story in South District
South District has great proximity to national parks, beaches, bays and rivers and has good transport infrastructure to the city and nearby areas. The District is close to both Port Botany and Sydney Domestic and International airports and has a vibrant multicultural community. This amenity and proximity to employment, as well as cultural diversity and areas that have historically been more affordable, make this a desirable location to live.
Housing Demand
The population is growing, older age groups are increasing as are smaller households and housing demand, including for studio, one and two bedroom homes. Despite a decline in low income households there has been a strong increase in low income renters competing for a dwindling supply of affordable rental.
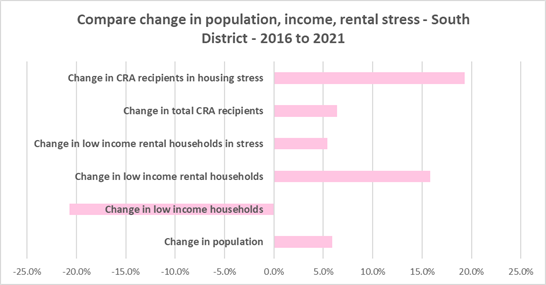
Between 2016 and 2021, the population of South District increased by 5.9%.
Generally, South District has slightly higher proportions of 0-19, 55-84 and 85+ year olds and lower proportions of 25--44 year olds than the average for Greater Sydney, with an increase in older age groups forecast. This indicates increasing demand for housing suitable for older residents.
Household types in the South District as a whole conform to the pattern of the average for Greater Sydney, with couple families with children being the largest household type, followed by couple families without children and lone person households. Between 2016 and 2021 there was a decline in the proportion of couple family with children households and increases in the proportion of couple family without children and lone person households in South District.
At the 2021 Census, high income households comprise the largest proportion of all households in South District. South District has a slightly higher proportion of low income households and a slightly lower proportion of high income households than the average for Greater Sydney.
Between 2016 and 2021 the number of low and moderate income households in South District declined while the number of high income households increased. However, over the same period, the number of very low income renters and low income renters increased in South District as a whole by 12.6% and 16.6% respectively.
In addition, at 2021, the homeless numbered 3,466 and the marginally housed 4,942 in South District.
What’s happening in the Market?
The housing market in South District is increasingly tight and unaffordable, with strong competition for what little affordable accommodation remains. There has been strong growth in median rents, especially since 2020, when Covid restrictions were relaxed. Further the vacancy rate has been tight for some time - at April 2023 the vacancy rate was just 1.2% in the middle ring and 1.3% in the outer ring. Vacancy rates below 3% represent a tight rental market while longer term vacancy rates below 2% (such as Sydney is currently experiencing) represent a chronic undersupply of rental housing.
At June 2022 both Sutherland and Georges River had a lower proportion of affordable private rental for very low income households than the Greater Sydney average and Canterbury-Bankstown, historically a more affordable rental area, had a higher proportion. At June 2022 of the South District LGAs, only Sutherland had a lower proportion of affordable private rental for low income households than the average for Greater Sydney. It is worth noting that having a higher proportion than the Greater Sydney average still does not make either Georges River or Canterbury-Bankstown affordable for rental.
It is likely that both Georges River and Sutherland have had some impact from the rise of short term rentals, with a key impact being a preference for investment in short term rather than long term rental – potentially impacting the supply of housing for long term rental.
At 2021, 93.6% of very low income households and 58.5% of low income households in South District were in rental stress and the number of very low income renters in stress increased across the District between 2016 and 2021. At the same time, the number of new rental bonds lodged affordable to low income households (and therefore affordable rental housing) declined by -7.1% just in the twelve month period from 2021 to 2022.
Between March 2020 and March 2022 there was strong growth in median house and strata prices across the South District. At March 2022, all the South District LGAs had a higher median sales price for houses than the Greater Sydney median of $1,203,000.
Purchase affordability for lower income households is extremely tight - at June 2021, all the South District LGAs, had 0.0% of sales affordable for purchase by very low income households. Both Georges River and Sutherland had 0.0% of housing affordable for purchase by low income households in 2021- while Canterbury-Bankstown had just 6.7% affordable purchase.
What’s happening with supply – and is it a good match?
There is a large and growing gap between the increasing number of low income earners in the private rental market and the declining number of private rental properties that are affordable for low income households in South District. There is also extremely limited opportunity for low income purchasers to buy a home in South District.
While low income rental households increased by 15.7% in South District between 2016 and 2021, affordable private rental housing declined, vacancy rates tightened, rents have increased and consequently access to affordable rental housing is extremely competitive, leading to increased levels of housing stress and homelessness.
As well as the gap between supply and demand for affordable rental, there is generally a significant gap between dwelling size (bedroom numbers) and household size.
At the 2021 Census, the majority of occupied dwellings in South District were separate houses, comprising 56.2% of all occupied dwellings, a little above the average of 55.4% for Greater Sydney.
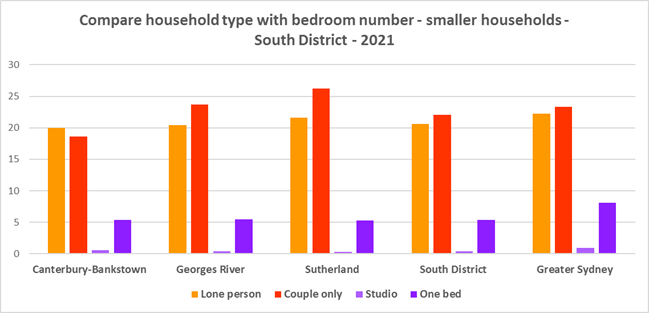
South District has insufficient variation in the number of bedrooms per dwelling, with the overwhelming majority of homes having three or more bedrooms. At the 2021 Census, 33.2% of dwellings had three bedrooms and a further 32.2% had four or more bedrooms, totalling 65.4% with three or more bedrooms. Only 0.4% of homes are studios, 5.4% have one bedroom and 27.3% have two bedrooms in South District. While there has been an increase in studio and one bedroom homes since the 2016 Census in South District, the number is easily outweighed by the increase in the number of four and more bedroom homes.
Although 42.7% of households in South District are lone person or couple only (below the 45.5% average in Greater Sydney), only 5.8% of dwelling stock is studio or one bedroom (compared with 9.0% in Greater Sydney). This mismatch can impact on affordability, with smaller households required to consume more housing than they need or to share because of lack of choice.
It also limits the opportunity for empty nesters or older single households to downsize to smaller more manageable homes within their communities. This can impact on the independence of older residents and their ability to age in place. This will become increasingly important as the population of South District is forecast to have an increase in older age groups.
There is a clear need for more affordable rental accommodation to begin to address the significant demand supply imbalance, particularly for lower income households and the increasing number of seniors and frail aged.
Enabling the provision of more semi-detached, terrace and town houses could help fulfil some of the demand for smaller more manageable homes, particularly if they have a smaller number of bedrooms. An increase in studio and one bedroom homes would help provide more housing choice. Two bedroom homes are the most flexible as they are suitable for single people, couples and small families and enable older residents to have a carer or relative stay.
Partnering or collaborating with community housing providers is one effective way to meet some of the local need for appropriate affordable housing. Not for profit community housing providers are owners, managers and developers of affordable rental housing for lower income households and residents with specific housing needs. They work with partners, investors and government to provide housing and deliver support for tenants.
Change 2016 to 2021
| Change in population | 5.9% |
|---|---|
| Change in low income households | -20.7% |
| Change in low income rental households | 15.8% |
| Change in low income rental households in stress | 5.4% |
| Change in total CRA recipients | 6.4% |
| Change in CRA recipients on housing stress | 19.3% |
Comparative Statistics
- Population at 2021: 753,491
- Number of dwellings at 2021: 271,326
- Number of households at 2021: 264,008
- Number of very low and low income households at 2021: 83,930
- Number of rental households at 2021: 81,213
- Number of very low and low income rental households at 2021: 30,628
- Number of very low and low income renters in Housing Stress at 2021: 23,391
- Increase in low income renters 2016 to 2021: 4,172
- Decline in new bonds lodged affordable for low income households 2021-2022: -247
- Number of new bonds lodged affordable for low income households 2021: 3,231
- Number of Homeless at 2021: 3,466
- Number marginally housed at 2021: 4,942
Key regional statistics
- Number of lone person households: 54,449
- Number of couple only households: 58,407
- Number of studio dwellings: 1,079
- Number of one bedroom dwellings: 13,679
- Number of unoccupied dwellings: 18,614
Additional information
Additional information on: