User guide
Learn how to navigate the interactive dashboards, use data filters to create and download customised displays and get a better understanding of statistics
Downloading customised graphs
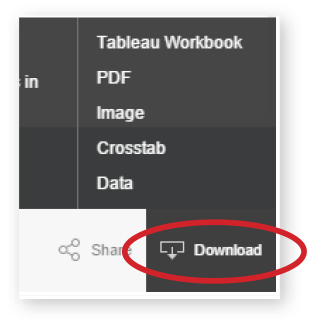
Data from FACS Statistics can be exported in a number of different formats. The entire dashboard can be exported as a Tableau workbook, PDF or image. If part of the graph is selected, it can be exported as a Crosstab or Data (both in CSV format)

Was this content useful?
Your rating will help us improve the website.
Last updated: 24 Sep 2019