User guide
Learn how to navigate the interactive dashboards, use data filters to create and download customised displays and get a better understanding of statistics
Customising
Using data filters to create customised displays
Using filters narrows the data shown in a view to focus on relevant information. Filter options vary according to each report. Note that not all reports have a filtering function. Where available, filters are located above each related graph.
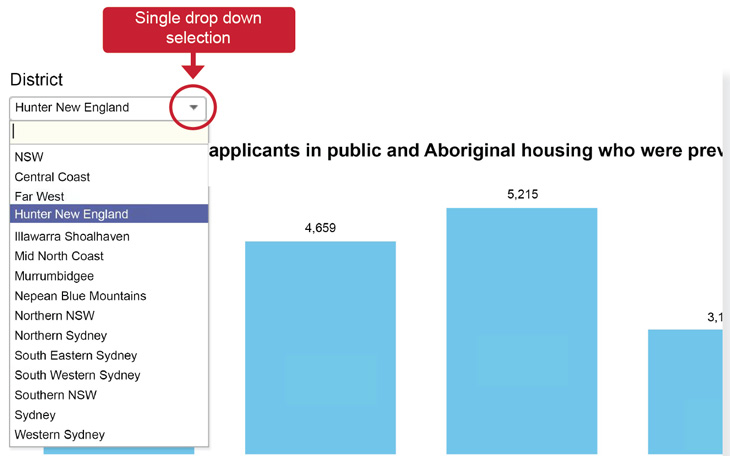
To customise reports, click on the drop-down arrow key on the filter and select the filter categories required. Where multiple filters exist for a report, each filter can be selected to identify what data are included or excluded from the view.

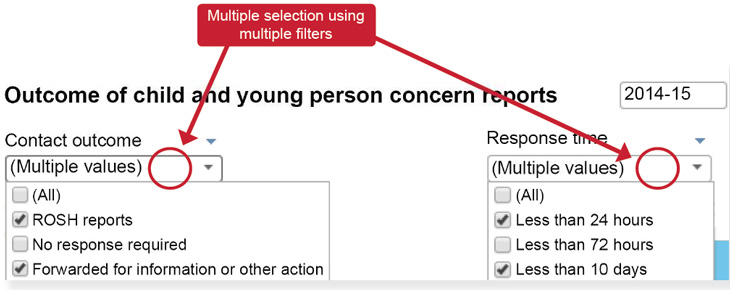
Two types of filters are used in FACS Statistics - single drop down and multi select:
- single drop down filters allow for selection of a single value only within the filter
- a multi-select filter may also be available for one or more filters in a graph. This allows for selection of multiple values within the one filter

The use of multi-select filters in the example below allows for a report to be customised to meet individual requirements.
