Housing Market Snapshot - North District
The North District extends from Hornsby and the Northern Beaches, south to Mosman and North Sydney and west to Ryde and Ku-ring-gai. It is home to significant employment hubs, transport and infrastructure and has high rates of amenity, with National Parks, beaches and harbour foreshore.
This is a highly desirable area to live in, with significant competition within both the rental and purchase markets and high housing costs. Some LGAs in this region have historically provided more affordable rental accommodation for very low and low income earners. However the amount of affordable accommodation available has drastically declined whilst demand has simultaneously increased, with higher income households outcompeting lower income households who are increasingly paying larger proportions of their income in housing costs.
What’s the housing demand?
The population is growing and aging, smaller households are increasing as is demand for housing. Despite a decline in low income households there has been a strong increase in low income renters competing for a dwindling supply of affordable rental.
Between 2016 and 2021, the population of North District grew by 9.3%. However, these figures mask considerable variation in population change amongst the LGAs of North District.
The median age of the population of the North District LGAs at the 2021 Census is generally older than the average for Greater Sydney of 37 years, and ranges between 37 years (Lane Cove and Ryde) and 46 (Hunters Hill). The District as a whole has lower proportions of 0-4, 20-24 and 25-34 year olds and higher proportions of all other age cohorts than the average for Greater Sydney. This indicates that there is a need for housing to suit older residents. Increasingly this will be the case as the number in older age cohorts grows.
There has been a shift in the proportions of different household types since the 2016 Census, with an increase in the proportion of lone person and couple family without children households, and declines in the proportion of couple family with children households, group households and other household types. The ongoing increase in smaller households will continue to have an impact on the demand for smaller properties.
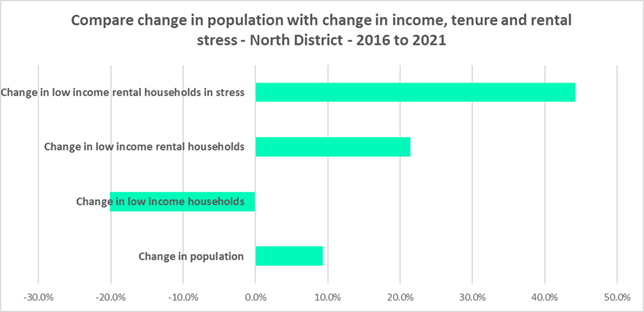
North District has a much higher proportion of high income households (66.4% compared to 49.7%) and much lower proportions of low (20.0% compared to 32.1%) and moderate income households (13.6% compared to 18.2%) than the average for Greater Sydney. Between 2016 and 2021 North District experienced declines in the number of low and also moderate income households and a strong increase in the number of high income households.
Yet despite the decline in low income earners across the District, over the same period the number of very low income renters and low income renters increased in North District, by 12.6% and 22.1% respectively. This suggests that low income rental households are choosing this location despite high housing costs relative to income and there is strong demand for affordable rental housing.
In addition, at 2021, the homeless numbered 1,630 and the marginally housed 1,243 in North District.
What’s happening in the market?
The housing market in North District is expensive and tight, with strong competition for what little affordable accommodation remains.
There has been strong growth in median rents, especially since 2020, when Covid restrictions were relaxed.
At April 2023 the vacancy rate was just 1.3% in Sydney overall, with 1.5% in the inner ring, 1.2% in the middle ring and 1.3% in the outer ring. Vacancy rates below 3% represent a tight rental market while longer term vacancy rates below 2% (such as Sydney is currently experiencing) represent a chronic undersupply of rental housing.
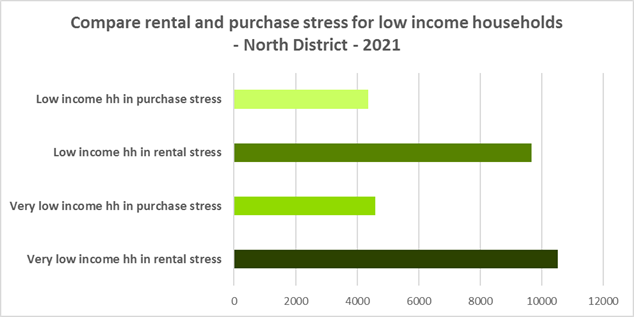
At June 2021 every LGA in North District had a higher proportion of very low income households in rental stress than the Greater Sydney average of 94.0%. At June 2022, every North District LGA had a lower proportion of affordable rental for very low income households than the Greater Sydney average of 10.7%. On average in Greater Sydney 61.4% of low income households were in rental stress at 2021, with the North District average significantly higher on 80.6% and every North District LGA having a higher proportion in stress than the Greater Sydney average.
The District experienced a 10.2% decline in affordable rental bonds lodged, and consequently loss of affordable private rental housing, just in the 12 months between 2021 and 2022.
Between March 2020 and March 2022 there was strong growth in median house and strata prices across the North District.
At the June quarter 2021 there were 0% of sales affordable for purchase to either very low or low income households in North District, while 71.4% of very low income purchasers and 54.0% of low income purchasers were in housing stress in North District (above the averages of 69.3% and 43.8% in Greater Sydney).
What’s happening with supply – and is it a good match?
There is a gap between bedroom mix and household size and between increasing demand for affordable rental and the availability of affordable private rental accommodation.
North District has a different dwelling mix to the average for Greater Sydney, although there is considerable variation between LGAs within the District. At the 2021 Census, separate houses comprised 50.9% of all occupied dwellings, below the average of 55.4% for Greater Sydney. Unlike most other parts of Sydney and NSW, flats comprise the next largest proportion of dwellings in North District with 39.4% compared to 12.9% in Greater Sydney. A further 9.2% of occupied homes in North District were semi-detached, terrace or town houses compared to 31.0% in Greater Sydney.
Three and four bedroom homes comprise the overwhelming majority of homes on average in Greater Sydney and the Rest of NSW, but North District generally has a little more diversity in bedroom mix. Again, there is considerable variation amongst LGAs within the District. However, 59.1% of households in North District are single person or couples without children yet only 11.8% of the stock is studio or one bedroom, limiting house choice for smaller households.
With an aging population and significant affordability issues, it is important to ensure a range of housing and a good bedroom mix to meet current and future demand. The current mismatch limits the opportunity for empty nesters or older single households to downsize to smaller more manageable homes within their communities. This can impact on the independence of older residents and their ability to age in place. Increasingly this will be an important issue, as North District is forecast to have an increase in older age cohorts.
There is a large and growing gap between the increasing number of low income earners in the private rental market and the declining number of private rental properties that are affordable for low income households. There is also no option for low income purchasers to buy a home in North District.
There is clearly strong demand for private rental, in part generated by proximity to employment and transport links, yet all LGAs are experiencing a decline in affordable private rental accommodation for low income households. There is a need for more targeted affordable rental and increased number of smaller dwellings, including studios, new generation boarding houses and one bedroom apartments to meet some of this demand and provide more housing choice.
Partnering or collaborating with community housing providers is one effective way to meet some of the local need for appropriate affordable housing. Not for profit community housing providers are owners, managers and developers of affordable rental housing for lower income households and residents with specific housing needs. They work with partners, investors and government to provide housing and deliver support for tenants.
Change 2016 to 2021
| Change in population | 9.3% |
|---|---|
| Change in low income households | -20.1% |
| Change in low income rental households | 21.4% |
| Change in low income rental households in stress | 44.2% |
| Change in total CRA recipients | 26.6% |
| Change in CRA recipients on housing stress | 20.0% |
Comparative statistics
- Population at 2021: 929,730
- Number of dwellings at 2021: 358,508
- Number of households at 2021: 338,653
- Number of very low and low income households at 2021: 65,569
- Number of rental households at 2021: 105,108
- Number of very low and low income rental households at 2021: 22,809
- Number of very low and low income households in rental stress at 2021: 20,204
- Decline in new bonds lodged affordable to low income households 2021 - 2022: 330 or 10.2%
- Number of homeless persons 2021: 1,620
- Number of marginally housed 2021: 1,243
Key district statistics
- Number of lone person households: 66,959
- Number of couple only households: 77,533
- Number of studio dwellings: 2,088
- Number of one bedroom dwellings: 28,255
Additional information
Additional information on: