Housing Market Snapshot - Illawarra Shoalhaven Region
The Housing story in the Illawarra Shoalhaven
The Illawarra Shoalhaven comprises the coastal areas of the regional city of Wollongong, plus the local government areas of Shellharbour, Kiama and Shoalhaven. Its’ proximity to Sydney and relative affordability have made the region popular with sea and tree changers. The popularity of short term rental accommodation through platforms such as Airbnb have also affected the housing market and demand for housing here. Bushfires and floods in parts of this region have had adverse impacts on the housing market and communities more broadly.
Infrastructure Australia’s report “2022 Regional Strengths and Infrastructure Gaps” notes that the Illawarra Shoalhaven region is home to world-class educational institutions, innovative businesses, a well-connected port and significant manufacturing capacity. Further, that growth has brought with it challenges surrounding availability of local employment, housing supply and pressure on transport infrastructure. The report cites the availability, affordability and diversity of housing as a key infrastructure gap in the region.
What’s the housing demand?
The population of the Illawarra Shoalhaven is growing, older age groups and smaller households are increasing and there has been a strong rise in low income households. This suggest demand for studio, one and two bedroom homes and affordable rental and purchase is also growing.
Between 2016 and 2021, the population of the Illawarra Shoalhaven grew by 7.4%
The median age of the population of the four Illawarra Shoalhaven LGAs at the 2021 Census ranges between 39 years (Shellharbour and Wollongong) and 48 (Kiama and Shoalhaven). This compares to the median age for the Rest of NSW (excluding Sydney) of 43 years. Both Shellharbour and Wollongong have higher proportions of every age cohort under 55 years and Kiama and Shoalhaven have higher proportions of every age cohort over 55 years of age. An increase in older age groups is forecast for every Illawarra Shoalhaven LGA, meaning increased demand for housing suitable for older age groups.
Across the region there is a slightly higher proportion of couple only households (27.7%) than couple family with children households (27.5%) and lone person households comprise the next largest household type (24.7%). Between 2016 and 2021 the proportion of couple only and lone person households increased, while the proportion of couple family with children households declined. A diverse range of housing is required to meet local need, particularly for smaller households given the increase in lone person and couple only households.
At the 2021 Census, low income households comprise the largest proportion of all households in each Illawarra Shoalhaven region LGA, with the exception of Kiama. There has been a shift between 2016 and 2021 - the number of low income households declined in Shoalhaven and Kiama and increased in Shellharbour and Wollongong and the number of high income households declined in Wollongong and Shellharbour and increased in Shoalhaven and Kiama. The predominance of low income households in the region points to high demand for affordable housing.
What’s happening in the market?
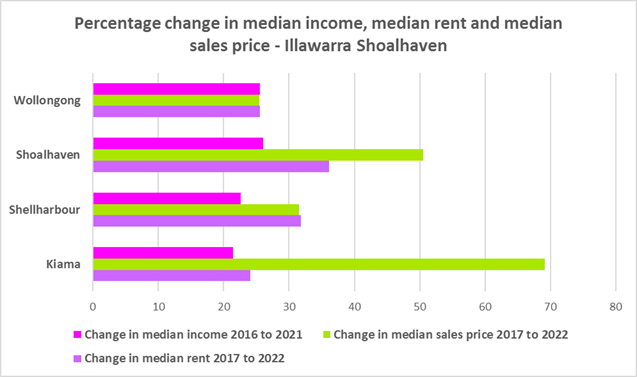
The Illawarra Shoalhaven has experienced strong price growth in both rents and sales, prolonged tight vacancy rates indicating an undersupply of private rental, loss of affordable rental housing supply yet strong demand from the significant number of low income residents, with many residents in housing stress. Generally housing costs are rising much faster than incomes.
There have been strong increases in median rents in all bedroom categories in the Illawarra Shoalhaven region for over two decades. At April 2023 the vacancy rate in Wollongong was 1.3%, in the rest of the Illawarra was 1.7% and for the South Coast was 2.1% - all very tight.
There has been a decline in the number of new rental bonds lodged which are affordable to low income households – indicating a reduction of affordable private rental – particularly in Shoalhaven. While Kiama and Shoalhaven are traditional tourist destinations, the rapid growth in on line listings and loss of affordable rental accommodation are likely connected, with tourist accommodation outcompeting longer term renting for locals.
There are high proportions of both very low and low income rental households in stress in the Illawarra Shoalhaven – ranging between 95.6% and 96.4% for very low income renters and 73.8% and 83.7% for low income renters. These are all indicators of a tough market for lower income renters.
The growth in median sales price in this region has been strong, particularly since 2020. Purchase affordability for very low income households is 0% and for low income households ranges between 0% and 3.2% - well below the Rest of NSW average of 7.5% for very low and 23.8% for low income households. 50.3% of very low and low income households are in purchase stress in the Illawarra Shoalhaven, however there are significantly more very low and low income rental households in stress.
What’s happening with supply – and is it a good match?
There is strong and growing demand for affordable housing across the region and a need for a better match between household type and bedroom mix as well as more suitable housing to meet the needs of older households.
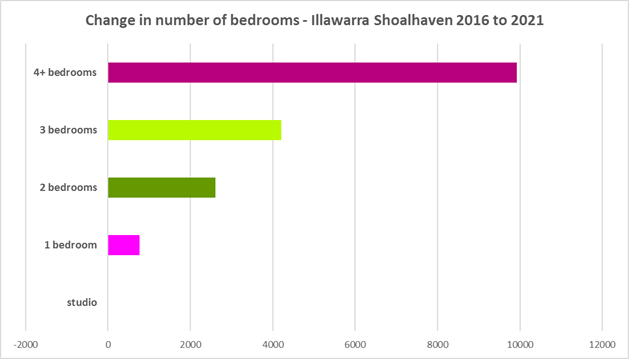
Although the local government areas of the Illawarra Shoalhaven vary somewhat in their age profile, household structure, income, tenure and housing market conditions, there is little difference within the region in bedroom mix. Much of the region’s dwelling stock was built a long time ago to suit families and is overwhelmingly three, four or more bedrooms. In Kiama and Shoalhaven in particular, the majority of households now living here are couples or single person households. The housing stock needs to adapt to better match households requirements.
At the 2021 Census, the clear majority of occupied dwellings in the Illawarra Shoalhaven were separate houses, comprising 75.8% of all occupied dwellings. More importantly, across the Illawarra Shoalhaven 41.4% of dwellings have three bedrooms and a further 35.0% have four or more bedrooms. Only 0.3% of homes are studios, 3.9% have one bedroom and 18.1% have two bedrooms.
Given that lone person and couple only households comprised 52.4% of all households in the Illawarra Shoalhaven, the fact that studio and one bedroom homes combined comprise just 4.2% of the housing stock shows a mismatch between household type and dwelling size and a significant lack of housing choice for smaller households. Kiama with 56.0% and Shoalhaven with 58.2% lone person and couple only households and only 3.1% and 2.6% studio and one bedroom dwellings respectively, particularly lack housing choice for residents. The forecast increase in older age groups in the region is likely to increase the demand for smaller, more manageable and affordable homes.
While the Illawarra Shoalhaven has been more affordable for both rental and purchase than neighbouring Sydney, it is more expensive than most regional areas of NSW. The number of low income households is increasing across the region – by 11.0% between 2016 and 2021 – signalling increased demand for affordable rental and purchase.
Considered together, the strong increase in rental levels, decline in rental affordability for lower income earners and decline in affordable rental properties, combined with the increase in and displacement of low income households, demonstrates the need to increase the supply of affordable rental housing for long term tenants.
Change 2016 to 2021
Comparative statistics
- Number of dwellings at 2021: 180,790
- Population at 2021: 422,440
- Number of households at 2021: 167,345
- Number of private rental households at 2021: 44,799
- The number of Very Low and Low income households at 2021: 74,481
- Number of Very Low and Low income rental households at 2021: 11,877
- Number of Very Low and Low Income Renters in Housing Stress at 2021: 10,235
- Reduction in new rental bonds lodged affordable for low income households (2017-2022): -20.8%
- Number of rental bonds lodged affordable for low income households 2022: 744
- Number of Homeless at 2021: 1,484
- Number of Marginally Housed at 2021: 861
Key regional statistics
- Number of lone person households: 41,314
- Number of couple only households: 46,292
- Number of studio dwellings: 451
- Number of one bedroom dwellings: 6,170
- Number of caravan, cabin, houseboat and improvised dwellings: 1,332
- Number of unoccupied dwellings: 21,299
Additional information
Additional information on:
What’s happening with demand is at